The KG Support And Resistance Indicator for MT4 is a powerful and highly visual trading tool that automatically detects and plots key support and resistance zones on your chart. These zones represent critical price levels where the market often reverses or consolidates, making them essential for planning trade entries and exits.
Unlike manual drawing, which can be subjective and time-consuming, this indicator uses historical price data to generate objective and accurate levels, helping traders make more confident decisions.
What Is the KG Support and Resistance Indicator?
This indicator simplifies technical analysis by automatically identifying important price zones across multiple timeframes. It is suitable for both beginner and advanced traders who want to improve their chart analysis without manual effort.
Key Features:
- Automatic support and resistance detection
- Multi-timeframe analysis
- Easy-to-read color-coded zones
- Objective, data-driven levels
- Works seamlessly on MT4 platform
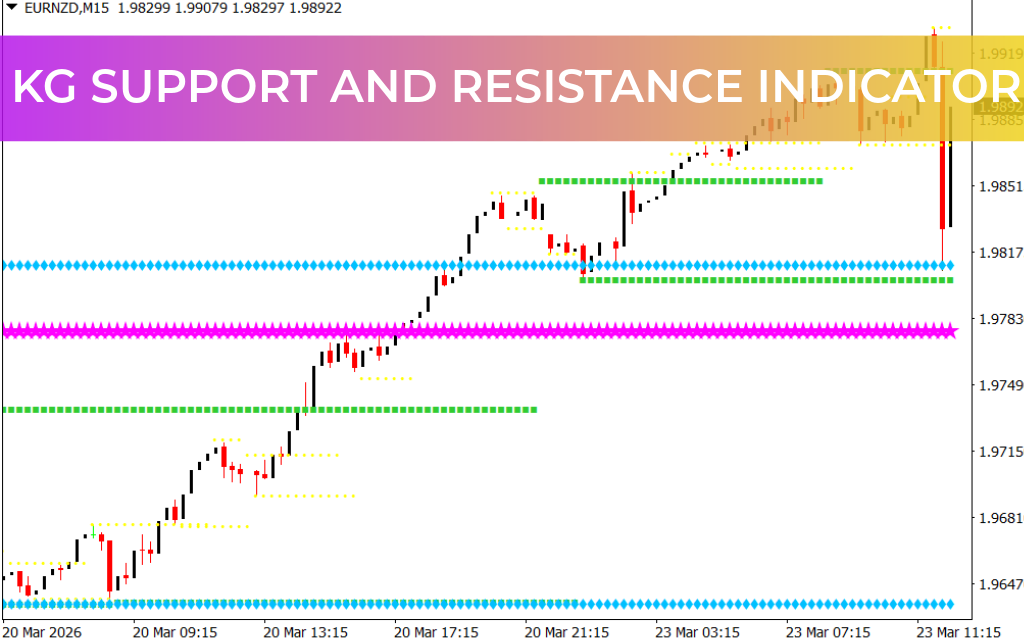
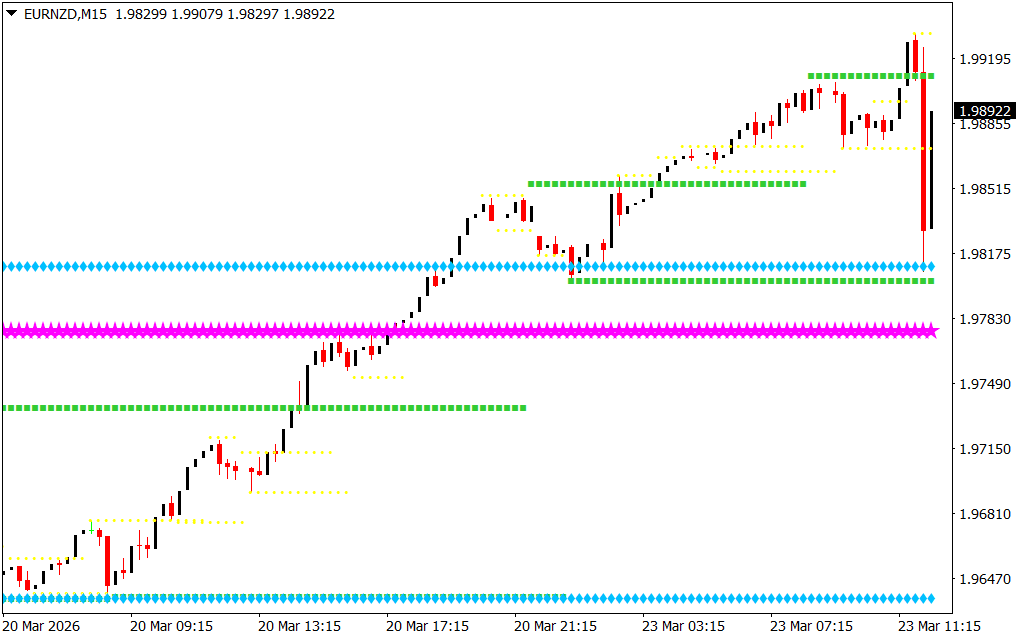
Color-Coded Multi-Timeframe Zones
One of the standout features of this indicator is its intuitive color-coding system:
- Yellow – 15-minute timeframe
- Green – 1-hour timeframe
- Blue – 4-hour timeframe
- Magenta – Daily timeframe
This structure allows traders to quickly identify the strength of each level. Zones from higher timeframes are typically more reliable and carry greater significance.
How to Use KG Support and Resistance Indicator
Although the indicator does not generate direct buy or sell signals, it provides powerful insights for decision-making.
Trading with Support and Resistance Zones:
- Buy (Long Entry): When price bounces from a support zone
- Sell (Short Entry): When price rejects a resistance zone
- Breakout Trading: When price breaks through a zone with strong momentum
Importance of Confluence
One of the most effective ways to use this indicator is by identifying confluence zones—areas where multiple support/resistance levels overlap across different timeframes.
For example:
- If 1-hour and 4-hour zones align, the level becomes a high-probability reversal area
- The more frequently a level is tested, the stronger it becomes
Combining these zones with Price Action or other indicators can significantly improve accuracy and reduce false signals.
Benefits of Using This Indicator
- Saves time by eliminating manual drawing
- Improves trade accuracy and timing
- Highlights high-probability trading zones
- Enhances Market Structure understanding
- Suitable for all trading styles
Conclusion
The KG Support and Resistance Indicator is an essential tool for any technical trader looking to simplify chart analysis and improve trading performance. Its automated, multi-timeframe approach provides a clear and structured view of the market, helping traders stay ahead of reversals, breakouts, and consolidations.
With its intuitive color-coded zones and reliable level detection, this indicator delivers practical insights that can enhance any trading strategy. Download it today and take your market analysis to the next level.
FAQ
1 Download
Published:
Mar 23, 2026 07:24 AM
Category: