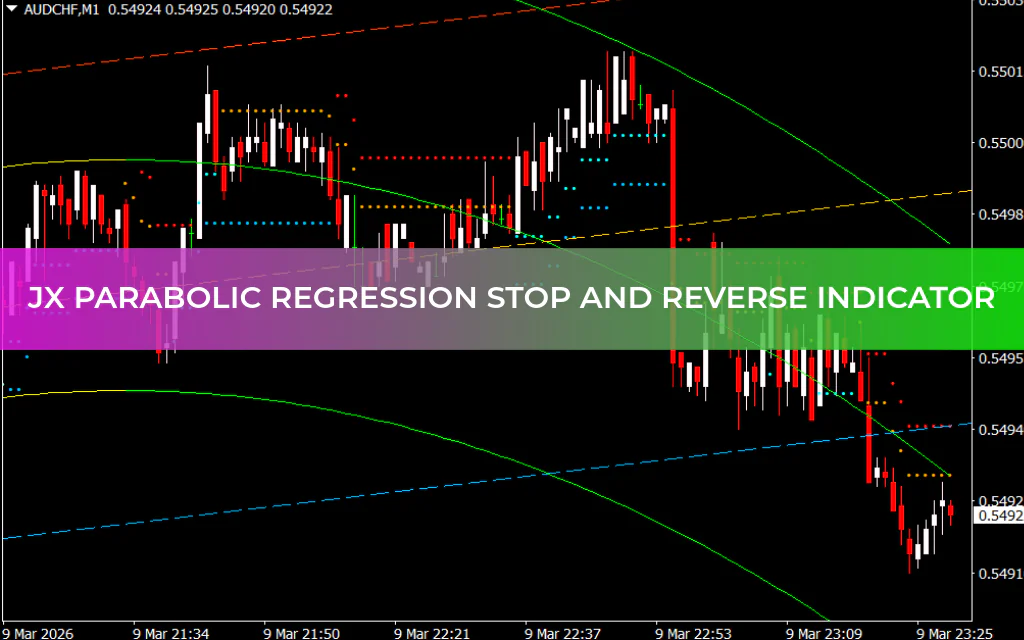
The JX Parabolic Regression Stop and Reverse Indicator for MT4 is a powerful technical analysis tool designed for traders who prefer channel-based trading strategies. This indicator combines a trendline channel with a dynamic regression channel to help traders identify trend direction, entry points, exit zones, and potential reversals.
Because it uses adaptive calculations and multiple channel structures, the indicator can provide precise Support And Resistance levels. It is suitable for both beginner and experienced traders and works across all financial instruments and timeframes.
What Is the JX Parabolic Regression Stop and Reverse Indicator?
The JX Parabolic Regression Stop and Reverse Indicator uses a combination of linear trend channels and curved regression channels to analyze market behavior.
At the center of the indicator is a golden trendline, which represents the main trend direction.
- When the golden line slopes upward, the market trend is bullish.
- When the golden line slopes downward, the market trend is bearish.
The steeper the slope of the golden line, the stronger the current trend.
Channel Structure Explained
The indicator uses several lines to form its channel system:
Trendline Channel
The linear channel consists of three main lines:
- Golden Line – Represents the primary trend direction
- Red Line – Acts as a resistance level
- Blue Line – Acts as a support level
These lines form a price channel where traders can identify potential entry and exit zones.
Curved Regression Channel
The indicator also includes a curved regression channel, which dynamically adapts to market conditions.
This channel helps traders:
- Predict future support and resistance levels
- Detect trend continuation or reversal zones
- Identify momentum shifts
During different market conditions:
- Yellow channel lines appear during bullish momentum
- Green channel lines appear during bearish momentum
Adaptive Stop and Reverse Levels
The indicator uses a specialized algorithm based on:
- Root Mean Square Deviation
- Fibonacci coefficients
These calculations generate adaptive stop and reverse levels, displayed as red or blue dots on the chart.
These dots help traders determine potential stop-loss levels and Trend Reversal points.
JX Parabolic Regression Stop and Reverse BUY Signal
To identify a BUY opportunity, follow these steps:
- Ensure the channel is slanting upward, indicating a bullish trend.
- Wait for the price to fall toward the lower band (support) of the channel.
- Look for a bullish candlestick pattern near the support level.
- Enter a BUY/LONG trade once confirmation appears.
A strong buy signal occurs when the curved regression channel crosses above the golden line while the trend continues upward.
JX Parabolic Regression Stop and Reverse SELL Signal
To identify a SELL opportunity, traders should look for the following:
- Price reaches the upper band (resistance) of the channel.
- The curved regression channel crosses below the golden line.
- Bearish Price Action appears near the resistance zone.
This setup suggests a potential downward movement, giving traders a SELL/SHORT opportunity.
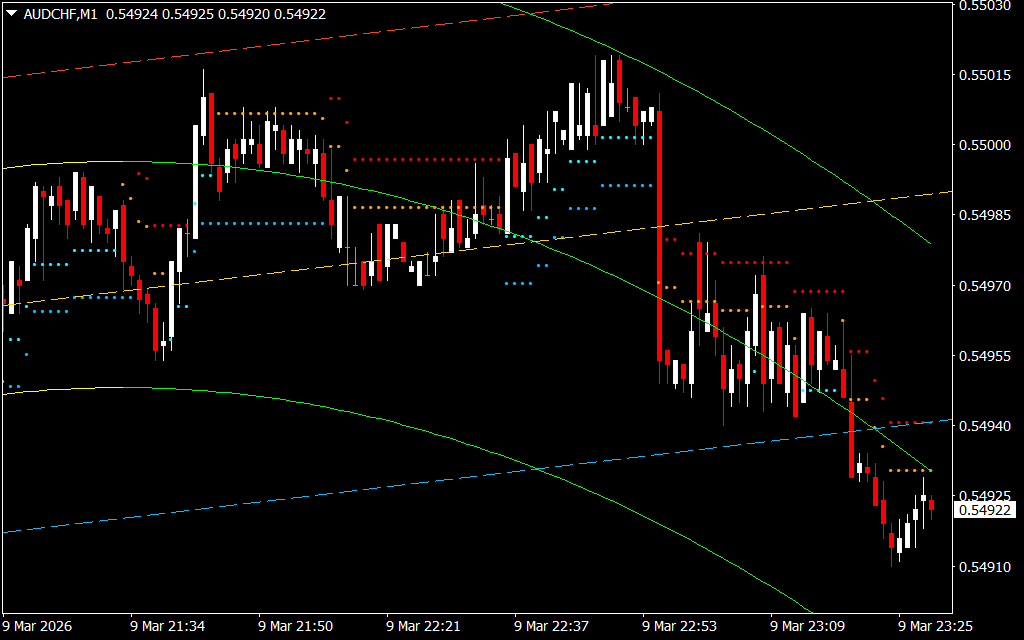
Trading Example
Consider a scenario where the Canadian Dollar (CAD) is trading against the Japanese Yen (JPY).
In the example chart:
- The price touches the support zone at the lower channel band.
- The curved regression channel crosses above the golden trendline.
- All channels begin sloping upward, confirming bullish momentum.
This combination indicates that the market may continue moving upward, creating a strong buying opportunity.
Why Traders Use This Indicator
The JX Parabolic Regression Stop and Reverse Indicator is popular because it provides:
- Clear channel-based trading structure
- Dynamic support and resistance levels
- Accurate trend detection
- Adaptive stop and reverse levels
- Works on all timeframes and markets
These features make it especially useful for channel traders and trend-following strategies.
Conclusion
The JX Parabolic Regression Stop and Reverse Indicator for MT4 is a versatile channel-based trading tool that helps traders identify trend direction, entry zones, support and resistance levels, and potential reversals.
By combining linear channels with dynamic regression analysis, the indicator offers a powerful way to understand Market Structure and locate high-probability trading opportunities.
You can download the JX Parabolic Regression Stop and Reverse Indicator for MT4 for free and use it to enhance your channel trading strategy.
FAQ
2 Downloads
Published:
Mar 09, 2026 18:30 PM
Category: