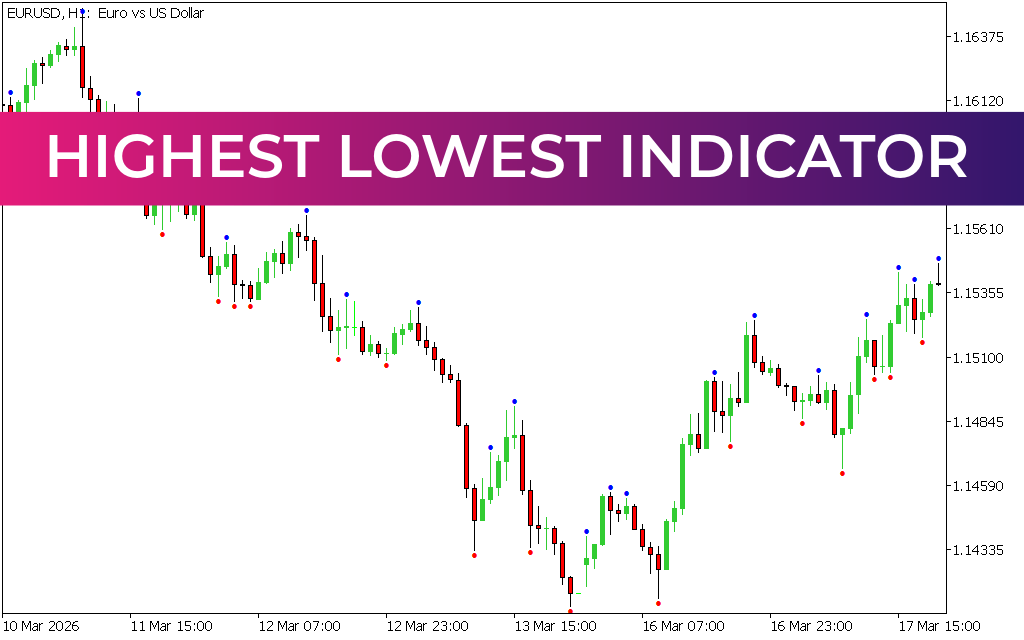
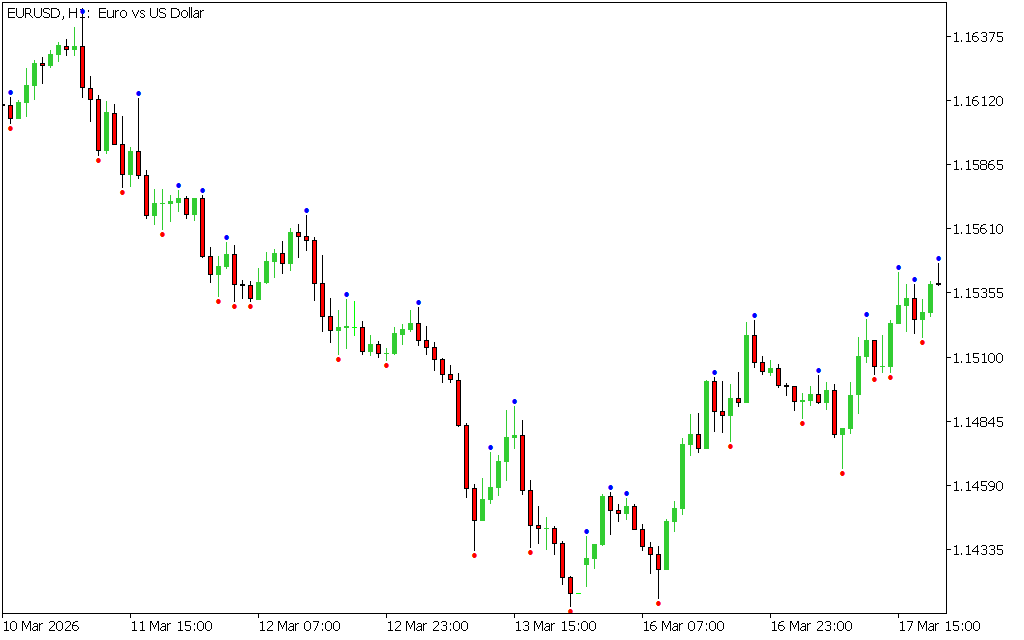
The Highest Lowest Indicator for MT5 is a simple yet powerful trading tool that automatically identifies and marks the highest and lowest price levels of a selected trading period. These levels are crucial for traders because they often act as strong support and resistance zones, where price frequently reacts, reverses, or breaks out.
This indicator helps traders understand key Market Structure levels such as daily highs/lows, weekly highs/lows, and historical extremes.
What is the Highest Low in MT5?
In MetaTrader 5, High/Low levels refer to the extreme price points reached during a specific period:
- Daily High/Low → Highest and lowest price of the day
- Weekly High/Low → Market extremes for the week
- Monthly High/Low → Long-term key levels
These levels are important because they often act as decision zones for buyers and sellers.
Key Features
- Automatically highlights highest and lowest price levels
- Works across multiple timeframes (daily, weekly, monthly)
- Helps identify key support and resistance zones
- Suitable for Scalping, intraday, and swing trading
- Simple and beginner-friendly
- Works with all trading instruments
How the Indicator Works
The Highest Lowest Indicator tracks price movement and marks:
- Highest level → Potential resistance zone
- Lowest level → Potential support zone
When price reaches these levels, traders typically expect:
- Reversal reactions
- Breakouts above/below levels
- Strong momentum moves
How to Trade with Highest Lowest Indicator
Buy Setup (Support Reaction)
- Price reaches previous low level
- Shows rejection (e.g., long wick, bullish engulfing candle)
- Buyers step in at support
👉 Enter a BUY trade
Stop Loss: Below the lowest level
Take Profit: Next resistance or swing high
Sell Setup (Resistance Reaction)
- Price reaches previous high level
- Shows rejection (e.g., bearish wick or engulfing candle)
- Sellers take control
👉 Enter a SELL trade
Stop Loss: Above the highest level
Take Profit: Next support or swing low
Breakout Strategy
The indicator is also useful for breakout trading:
- Break above high → bullish continuation
- Break below low → bearish continuation
In this case, traders wait for:
- Strong breakout candle
- Retest confirmation (optional)
Trading Tips
- Combine with:
- Price Action (candlestick patterns)
- Trend indicators (EMA, TEMA, etc.)
- Volume or momentum tools
- Higher timeframe levels are more reliable
- Avoid trading blindly at levels without confirmation
Why Use the Highest Lowest Indicator?
This indicator helps traders:
- Identify key market turning points
- Plan entries and exits more effectively
- Improve support/resistance accuracy
- Trade reversals and breakouts with confidence
Limitations
- Does not generate direct buy/sell signals
- Requires confirmation from price action
- Less effective in highly volatile news conditions
Conclusion
The Highest Lowest Indicator for MT5 is an essential tool for understanding market structure. By clearly marking key price extremes, it helps traders anticipate reactions at major support and resistance zones.
When combined with price action and trend analysis, it becomes a powerful tool for both reversal and breakout trading strategies.
4 Downloads
Published:
Apr 12, 2026 13:01 PM
Category: