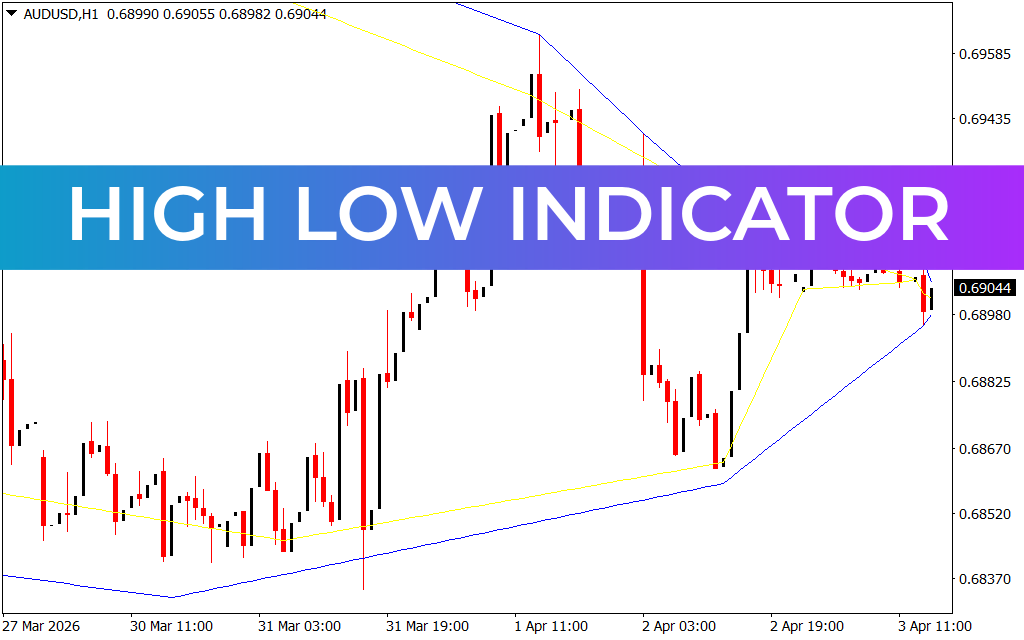
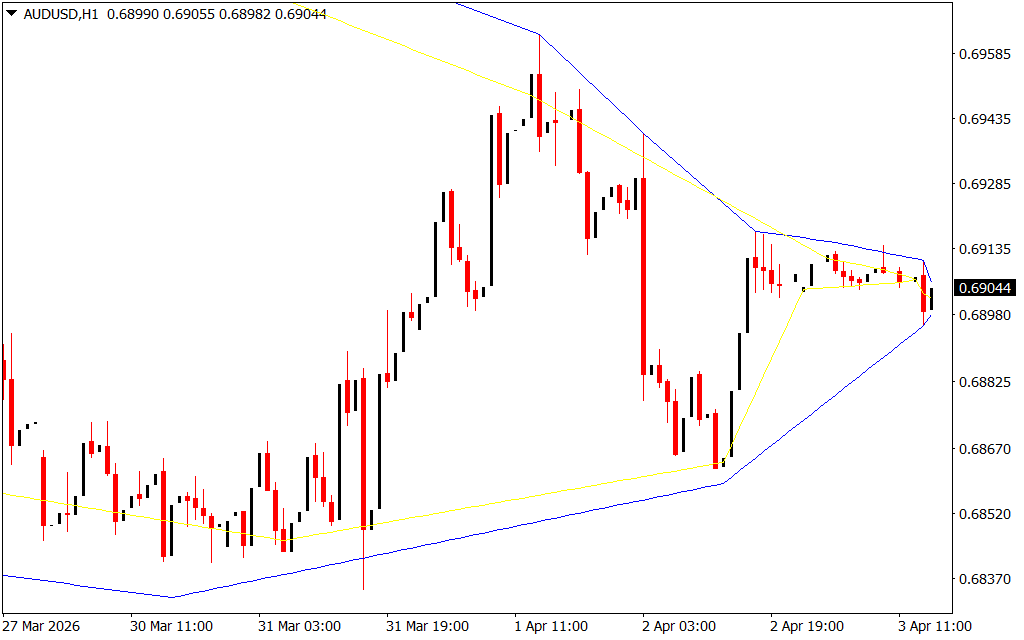
The High Low Indicator for MetaTrader 4 (MT4) is a versatile technical tool that plots two bands—black and blue—that encapsulate the highs and lows of price movements. These bands help traders identify both breakout and continuation opportunities, making the indicator useful for intraday and swing trading strategies.
Key Features
- Dual Bands: Black and blue bands highlight market highs and lows.
- Directional Bias: Bands pointing upward indicate bullish bias, while downward bands suggest bearish bias.
- Breakout & Continuation Utility: Can be used to spot both breakout and continuation setups.
- Multi-Timeframe Compatibility: Works across intraday and higher timeframes.
- Simple Interpretation: Easy to use for both new and experienced traders.
How to Use the High Low Indicator
There are two primary ways to trade using this indicator:
1. Breakout Trading
- When the bands are narrow, the market is likely preparing for a breakout or reversal.
- Wait for a breakout candle to close beyond the bands.
- Confirm the direction of the bands before entering trades.
2. Continuation Trading
- When the bands are wide, the market is trending strongly.
- In a downtrend, short trades can be taken when price touches the upper band.
- In an uptrend, long trades can be taken when price touches the lower band.
Benefits for Traders
- Scalpers: Identify quick breakout opportunities.
- Day Traders: Use band direction for intraday bias.
- Swing Traders: Spot continuation setups on broader timeframes.
- Pattern Analysts: Compare band behavior with Bollinger Bands for confirmation.
Conclusion
The High Low Indicator for MT4 is a straightforward yet effective tool for identifying breakout and continuation opportunities. Similar to Bollinger Bands, it provides directional bias and helps traders plan entries with clarity. For best results, test the indicator on broader timeframes and multiple assets in a demo environment before applying it to live trading.
1 Download
Published:
Apr 03, 2026 09:19 AM
Category: