Free
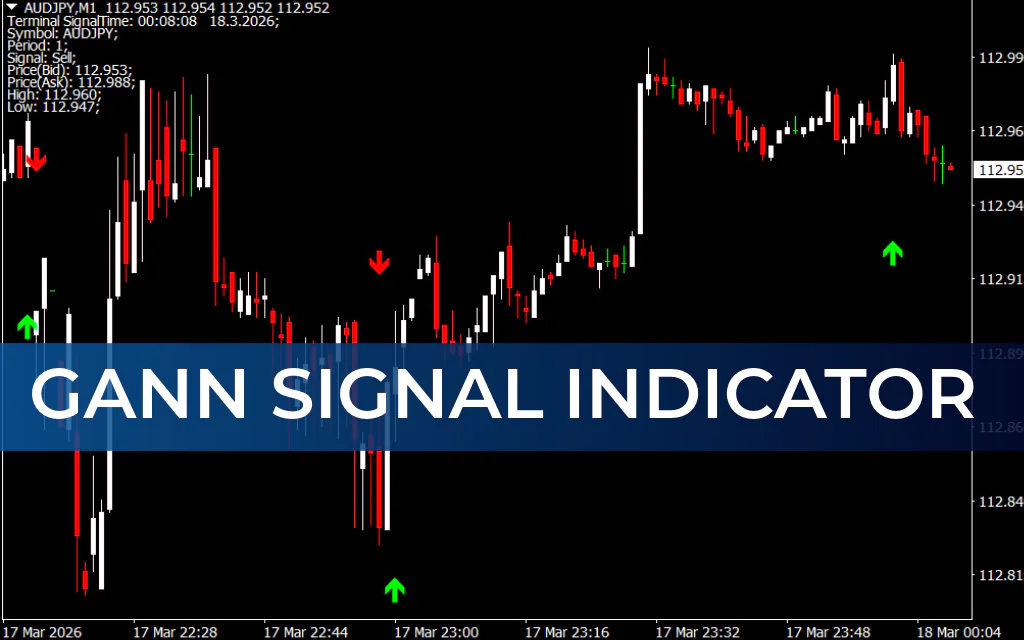
The Gann Signal Indicator is based on the Gann angles developed by WD Gann, a legendary trader known for his mastery of price, time, and pattern analysis. Traditionally, drawing Gann angles requires precision and patience, but this indicator automates the process, providing clear buy and sell signals with arrows.
How the Gann Signal Indicator Works
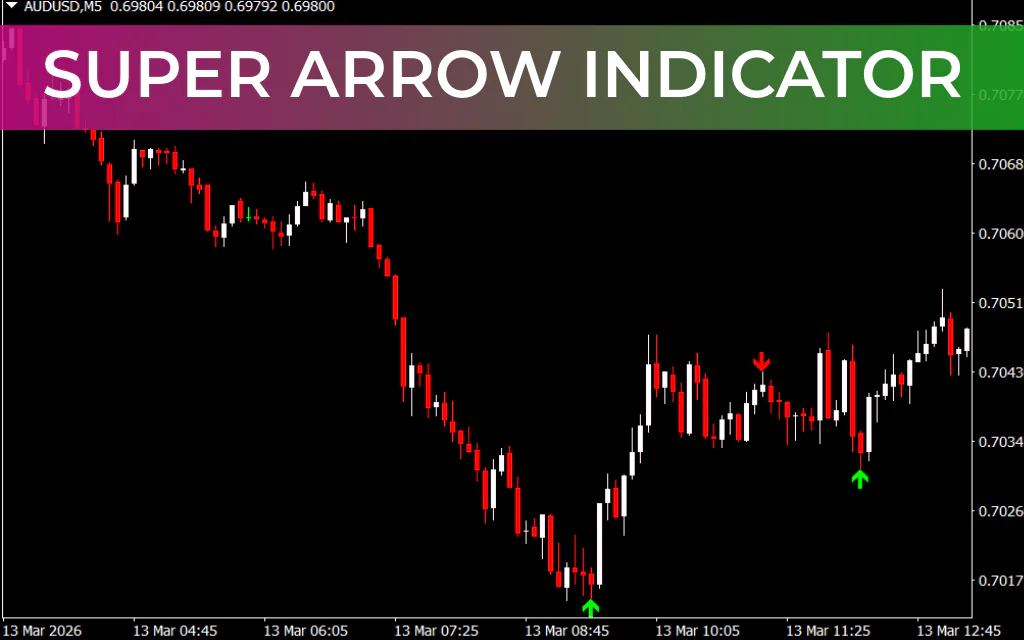
- Arrows for trade signals:
- Green arrow: Indicates a potential buy position.
- Red arrow: Indicates a potential sell position.
- Supports all currency pairs and timeframes, from 1-minute to daily charts.
- Can be combined with trend-following indicators for better accuracy.
- Simplifies Gann analysis by highlighting Support And Resistance levels automatically.
How to Use the Gann Signal Indicator
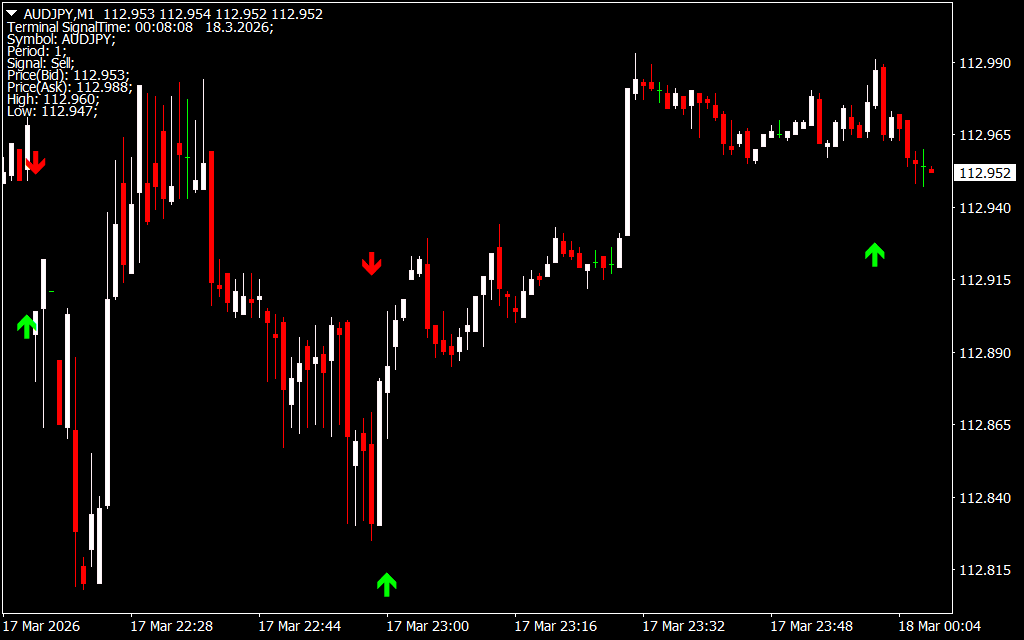
- Wait for arrows to appear on the chart:
- Green arrow → BUY
- Red arrow → SELL
- Consider market trend:
- Avoid taking green arrows in a downtrend.
- Avoid taking red arrows in an uptrend.
- Confirm entry:
- Use trend-following tools, support/resistance zones, or candlestick patterns to filter false signals.
- Set stop-loss and take-profit levels:
- Place stops below recent swing lows for buys, and above swing highs for sells.
Example
On the GBP/CHF chart:
- The first red arrow appears near a resistance zone → excellent sell entry.
- Price drops, confirming the trend and yielding profit.
- The green arrow appears after the market begins trending upwards → ideal buy entry.
By following the arrows in combination with market trend, traders can catch high-probability trade setups.
Conclusion
The Gann Signal Indicator for MT4 makes Gann’s complex trading methods accessible:
- No need to manually draw angles
- Signals appear automatically via arrows
- Supports multiple timeframes and currency pairs
- Can be combined with trend-following tools for better results
This indicator is ideal for both beginners and experienced traders who want to take advantage of Gann’s time and price analysis without the tedious calculations.
FAQ
Automated green buy and red sell arrows with implied angular support/resistance geometry beneath hood.
Avoid buying fresh green signals deep inside macro downtrend and avoid sells inside macro uptrend without compelling reason.
Layer trend tools, S/R, or candle triggers to veto low-quality arrows.
Stops beyond recent swings opposing trade direction aligning with classic money management.
M1 through daily are named in the compatibility list.
Published:
Mar 17, 2026 19:09 PM
Category:
Share: