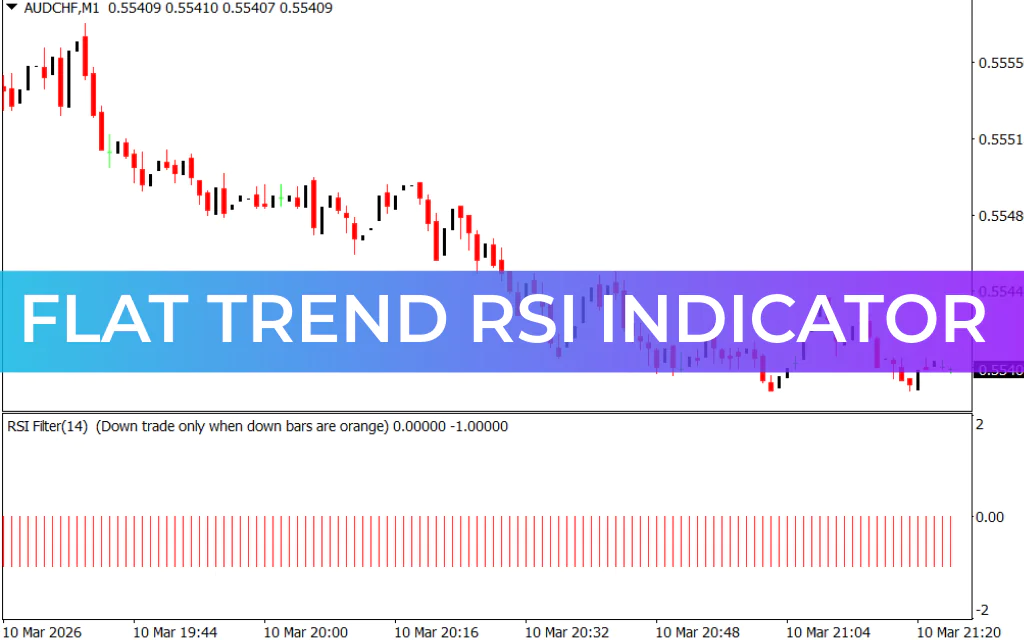
The Flat Trend RSI Indicator for MT4 is a momentum-based technical tool that helps traders identify Trend Strength and potential market reversals. Built on the principles of the Relative Strength Index (RSI), this indicator simplifies RSI signals by displaying them in a clear bar-chart format.
As a momentum oscillator, the Flat Trend RSI fluctuates between two extremes to highlight overbought and oversold market conditions. This makes it easier for traders to detect shifts in market momentum and determine when a trend may be losing strength or preparing for a reversal.
The indicator can be used as a standalone trading tool or integrated into a broader trading strategy. Many traders combine it with other indicators or Price Action analysis to confirm signals and improve entry and exit timing.
How the Flat Trend RSI Indicator Works
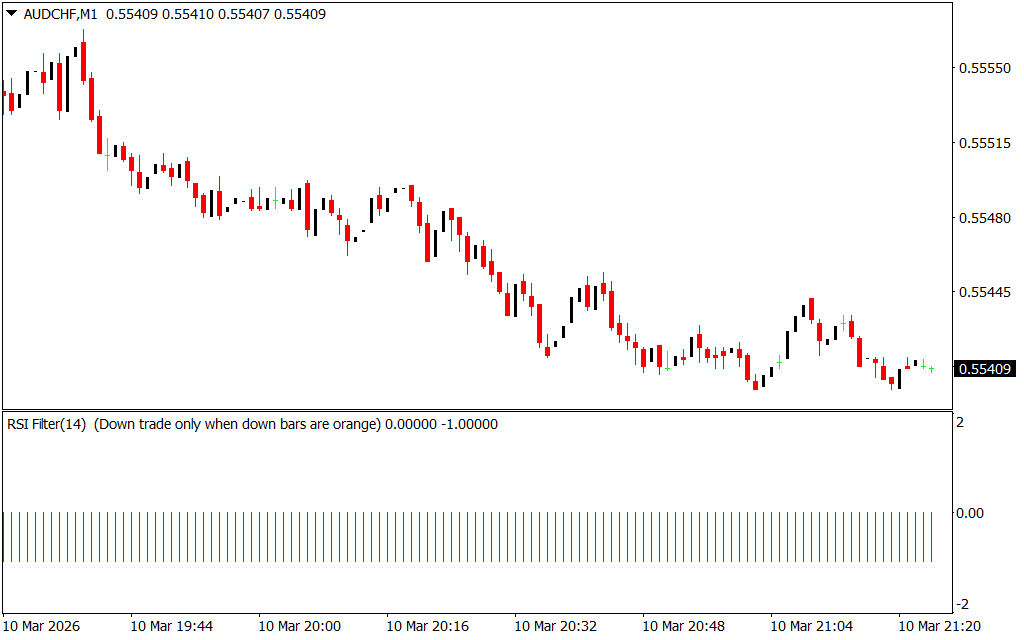
The Flat Trend RSI appears in a separate window below the price chart. It displays colored bar charts, with each bar representing the momentum of a corresponding candlestick on the chart.
The indicator uses color changes to indicate shifts in market sentiment:
- Blue Bars: Indicate bullish momentum and potential upward trends.
- Red Bars: Indicate bearish momentum and potential downward trends.
By monitoring these color transitions, traders can identify potential buy and sell opportunities in the market.
Flat Trend RSI Buy and Sell Signals
Buy Signal
A buy signal occurs when the indicator bars switch from red to blue, indicating that bullish momentum is entering the market.
Steps for a buy trade:
- Wait for the indicator to change from red bars to blue bars.
- Confirm that the market shows signs of an upward trend.
- Enter a buy (long) position.
This transition suggests that market sentiment is shifting from bearish to bullish.
Sell Signal
A sell signal occurs when the indicator bars change from blue to red, indicating bearish momentum.
Steps for a sell trade:
- Wait for the indicator to change from blue bars to red bars.
- Confirm that the market is showing downward pressure.
- Enter a sell (short) position.
This change suggests that sellers are gaining control of the market.
Trading Example
On a EUR/USD 4-hour chart, the Flat Trend RSI highlights potential trend shifts. When the bars switch from red to blue, it signals a potential bullish trend, prompting traders to consider a buy position. Conversely, when the bars switch from blue to red, it indicates a possible bearish trend and a sell opportunity.
The indicator can also be applied to multiple timeframes, allowing traders to adapt it to different trading styles such as Scalping, intraday trading, or swing trading.
Advantages of the Flat Trend RSI Indicator
The Flat Trend RSI offers several benefits for traders:
- Helps identify trend strength and momentum shifts
- Simplifies RSI signals with easy-to-read bar charts
- Detects potential trend reversals quickly
- Works across multiple timeframes and trading strategies
- Suitable for both beginner and experienced traders
Conclusion
The Flat Trend RSI Indicator for MT4 is a powerful momentum tool that helps traders identify when the market is trending and when a reversal may occur. By monitoring the color changes in the indicator bars, traders can quickly spot potential buy and sell signals and align their trades with market momentum.
When combined with sound risk management and additional technical analysis, the Flat Trend RSI can become a valuable part of a trader’s forex strategy.
FAQ
2 Downloads
Published:
Mar 10, 2026 16:25 PM
Category: