The Fibonacci Golden Zone Dashboard Indicator for MT5 is a powerful analytical tool designed to visualize high-probability reversal areas across multiple timeframes using Fibonacci retracement levels. Built on ZigZag market structures, it highlights Golden Zones — typically between the 61.8% and 78.6% retracement levels — where price is statistically more likely to react.
With its intuitive dashboard layout, traders can instantly view Fibonacci retracement zones across major timeframes, making it an excellent solution for swing trading, intraday strategies, and Scalping. Instead of manually analyzing each chart, this indicator provides a centralized multi-timeframe overview of potential reversal zones.
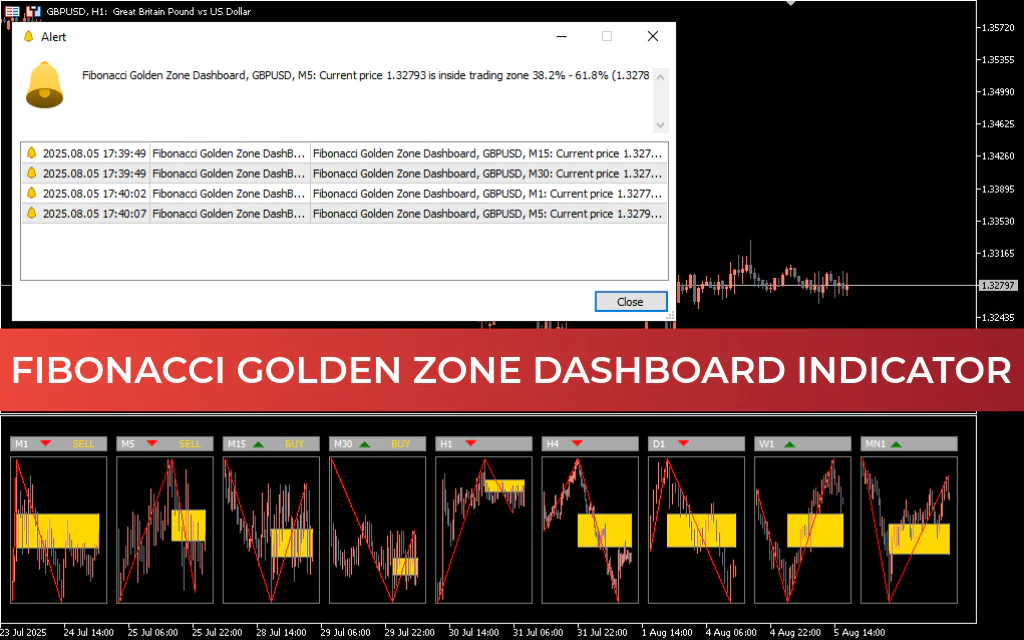
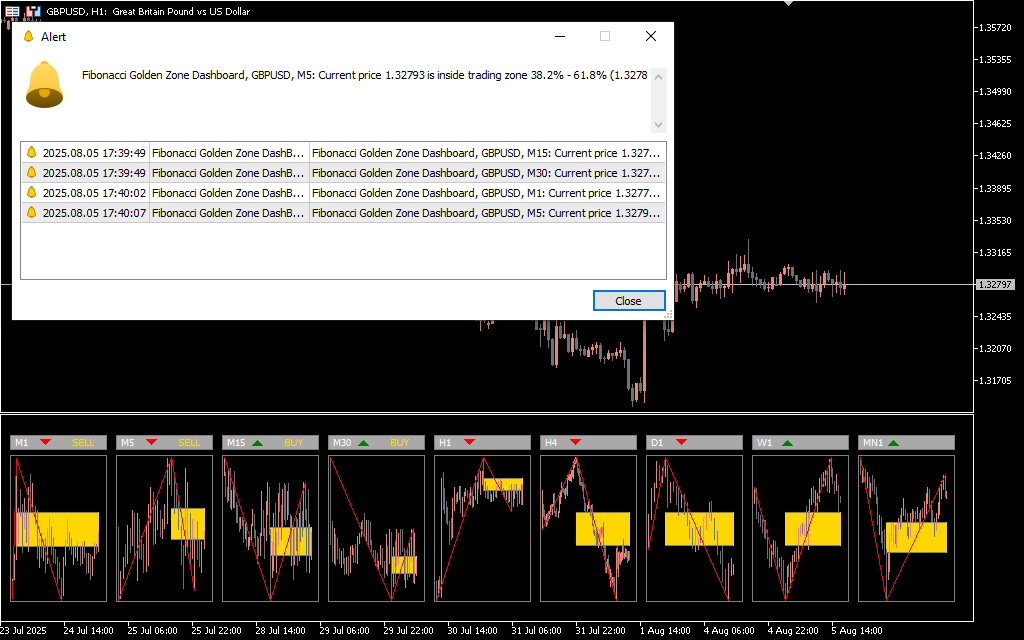
Fibonacci Golden Zone Dashboard Trading Signals
The indicator automatically plots ZigZag swings for each selected timeframe and highlights the Fibonacci Golden Zone in yellow, signaling potential retracement or reversal opportunities.
Each timeframe panel (from M1 to MN1) displays:
- The current ZigZag Market Structure
- Highlighted Golden Zone (61.8%–78.6%)
- BUY or SELL labels based on recent swing direction
- Directional arrows to indicate potential trade bias
When price enters the Golden Zone, traders can anticipate a possible reaction and prepare for structure-based setups.
These signals can be used to:
- Identify potential reversal areas near key Fibonacci levels
- Confirm confluence with support, resistance, or divergence
- Align entries across multiple timeframes
- Improve precision when trading pullbacks or swing continuations
Conclusion
The Fibonacci Golden Zone Dashboard Indicator for MT5 simplifies Fibonacci-based trading by presenting key retracement zones across multiple timeframes in one clear interface. By highlighting high-probability Golden Zones and providing real-time directional context, it helps traders make more informed and timely decisions.
Whether you trade reversals, pullbacks, or trend continuations, this dashboard offers a practical and efficient way to track Fibonacci structure across the entire market landscape.
FAQ
11 Downloads
Published:
Feb 28, 2026 09:43 AM
Category: