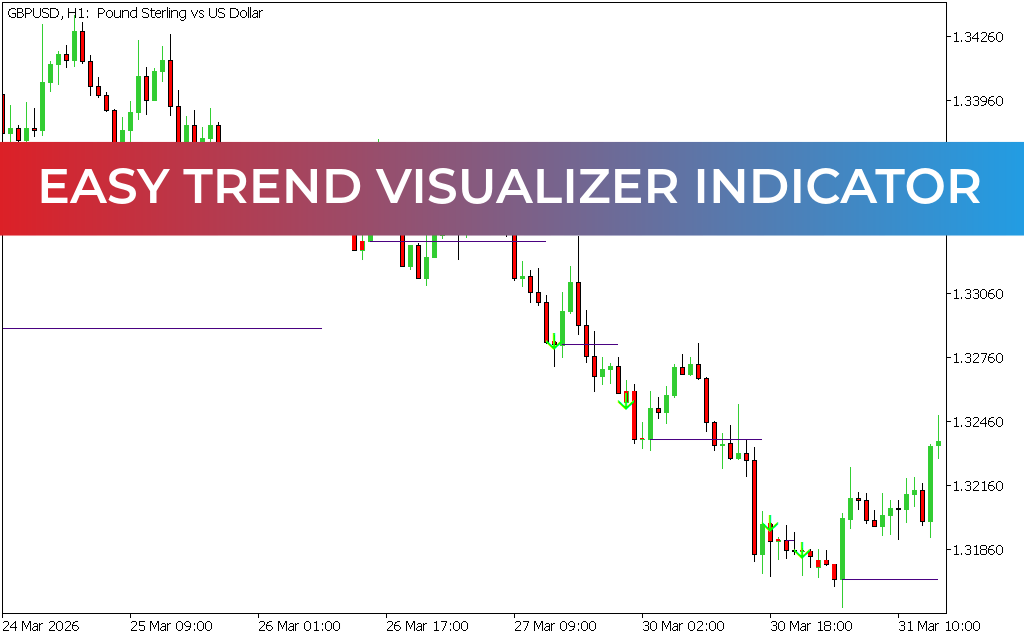
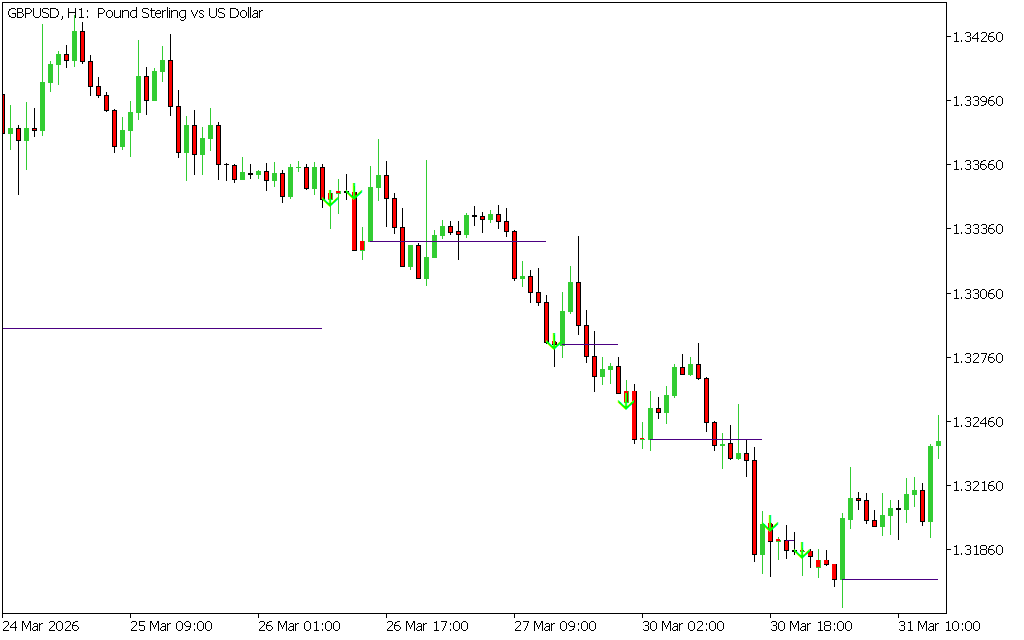
The Easy Trend Visualizer Indicator for MT5 is a dynamic trend-following tool designed to simplify market analysis by visually displaying trend direction, strength, and reversal zones. It uses a combination of three Average Directional Index (ADX) calculations along with arrows and horizontal bars to help traders identify entry and exit opportunities with clarity.
Built for the MetaTrader 5 trading platform, this indicator is suitable for Scalping, intraday trading, and swing trading strategies.
What Is the Easy Trend Visualizer Indicator?
The Easy Trend Visualizer transforms complex trend data into simple visual signals:
- Arrows: Indicate potential trend start and trade entry points
- Horizontal bars: Signal possible trend exhaustion or reversal
- ADX-based structure: Measures Trend Strength and direction
This makes it easier for traders to follow market momentum without complex analysis.
Key Features
- Built using 3-layer ADX trend strength system
- Clear arrow-based buy and sell signals
- Horizontal bars indicate trend ending zones
- Works across all timeframes
- Suitable for all trader experience levels
How the Indicator Works
The indicator provides two main types of signals:
- 📈 Arrow signals: Suggest the beginning of a new trend
- 📉 Horizontal bars: Indicate weakening momentum or trend end
These visual cues help traders understand when to enter or exit trades.
How to Trade Using Easy Trend Visualizer
📈 Buy Setup
- Arrow appears signaling bullish trend start
- Price structure confirms upward momentum (higher highs/lows)
- Enter buy trade after confirmation
- Use previous swing low as stop-loss reference
📉 Sell Setup
- Bearish arrow appears indicating Trend Reversal
- Price shows rejection patterns (e.g., double top or bearish engulfing)
- Enter sell trade after confirmation
- Use recent swing high for stop-loss
Best Trading Strategy
For better accuracy, combine the indicator with:
- Price Action patterns (candlestick confirmation)
- Support and resistance levels
- Trend filters (moving averages or ADX confirmation)
- Multi-timeframe analysis (MTF strategy)
Why Traders Use Easy Trend Visualizer
- Simplifies trend identification
- Provides clear entry and exit signals
- Reduces emotional decision-making
- Works well for beginners and experienced traders
Conclusion
The Easy Trend Visualizer Indicator for MT5 is a user-friendly trend detection tool that helps traders identify market direction and timing using visual signals. By combining ADX-based analysis with arrows and trend exhaustion markers, it offers a simplified way to follow trends and manage trades effectively. When used with price action confirmation, it can significantly improve trading accuracy.
3 Downloads
Published:
Apr 10, 2026 12:14 PM
Category: