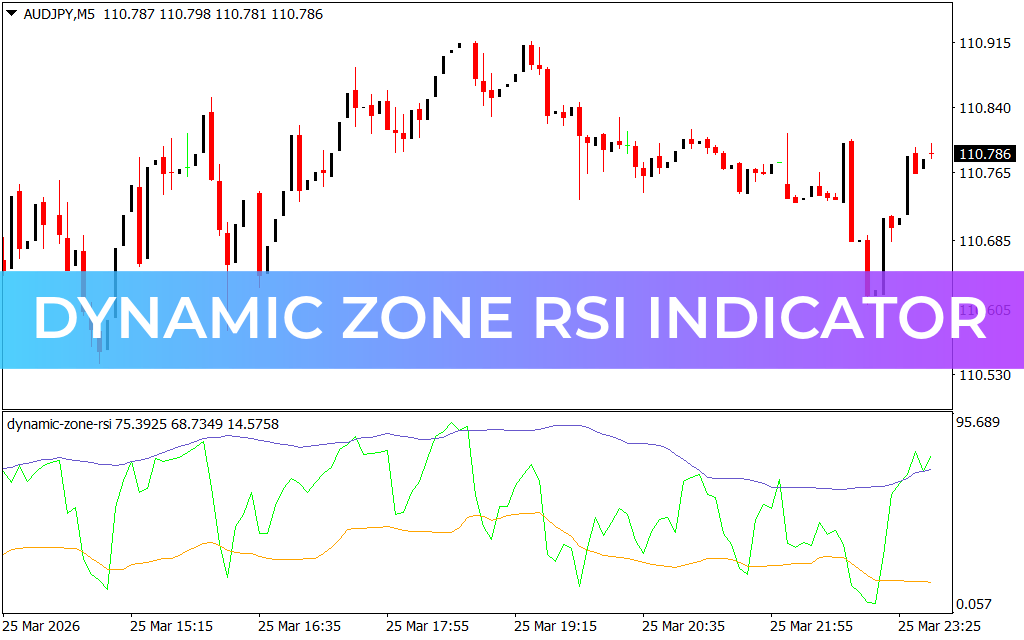
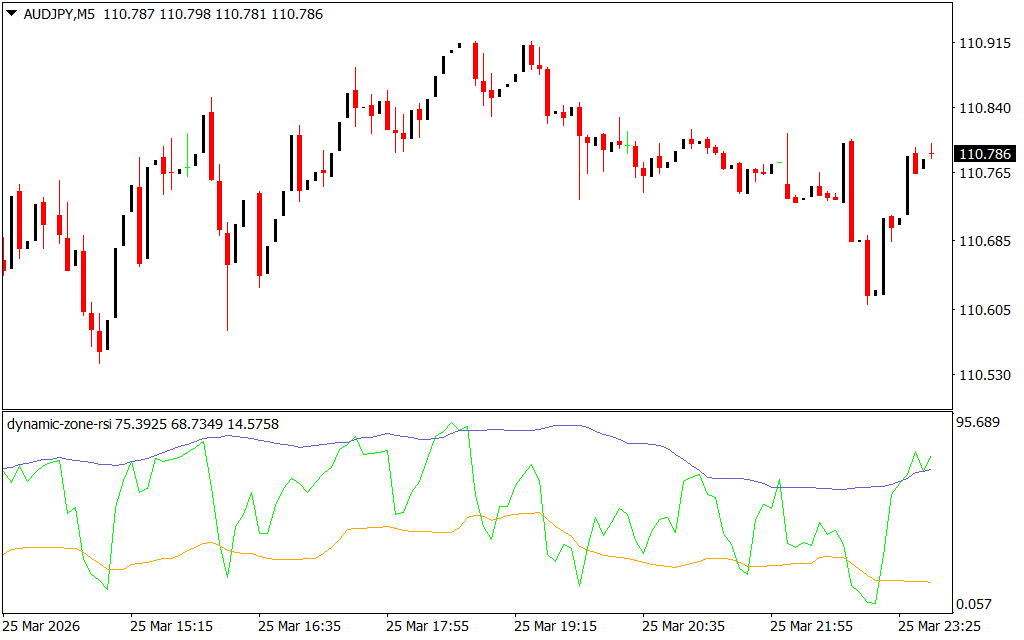
The Dynamic Zone RSI Indicator for MetaTrader 4 (MT4) elevates the traditional Relative Strength Index (RSI) by integrating dynamic bands to detect overbought and oversold conditions. Unlike standard RSI thresholds, this indicator adapts to changing market conditions, offering a flexible and more accurate method to identify trading opportunities. Ideal for day traders, swing traders, and long-term investors, the Dynamic Zone RSI Indicator refines market entries and exits for better trading results.
How the Dynamic Zone RSI Indicator Works
The indicator generates signals based on the RSI’s interaction with dynamic Support And Resistance bands:
- Overbought Signals: When the RSI crosses above the upper dynamic band, it signals a potential short or sell opportunity.
- Oversold Signals: When the RSI drops below the lower band, it indicates a possible long or buy opportunity.
These dynamic levels automatically adjust to market volatility, reducing false signals and improving overall trading accuracy. Traders can enhance their strategies by combining the Dynamic Zone RSI with tools like moving averages, trendlines, or Price Action patterns. Divergences between RSI and price provide additional insights into potential trend reversals, supporting better risk management and decision-making.
Why Choose the Dynamic Zone RSI Indicator
By merging the reliability of the RSI with adaptive dynamic zones, this indicator gives traders a significant edge in identifying critical market levels. Whether trading forex, stocks, or commodities, it adapts to evolving market conditions, helping traders stay ahead of trends and reversals. Its precision and flexibility make it an essential tool for traders seeking actionable, high-probability signals.
Download the Dynamic Zone RSI Indicator today and enhance your trading strategy with adaptive, accurate signals!
FAQ
3 Downloads
Published:
Mar 25, 2026 18:48 PM
Category: