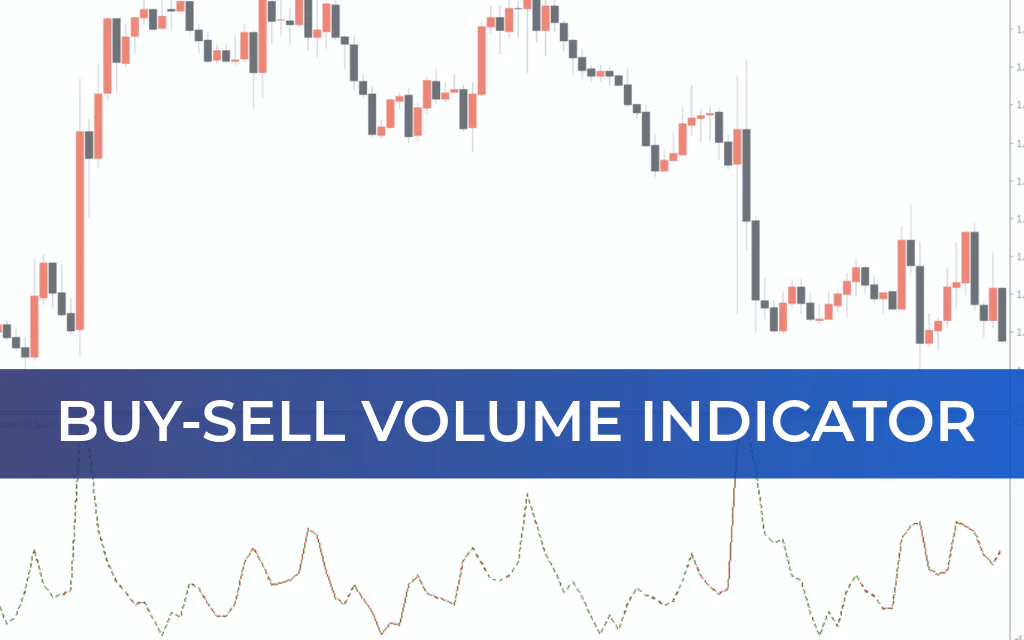
The Buy-Sell Volume Indicator for MT4 helps traders evaluate the strength and weakness behind price movements. In live markets, successful traders aim to join bullish or bearish moves that show strong underlying momentum.
One of the most reliable ways to measure Trend Strength is through volume analysis. Volume reflects the level of participation behind Price Action and plays a key role in confirming breakouts and trend-following opportunities.
The Buy-Sell Volume Indicator serves as a volume strength filter, helping traders select high-probability setups rather than generating direct buy or sell signals.
How the Buy-Sell Volume Indicator Works
The indicator continuously compares bullish and bearish pressure using a dotted curve that reflects increasing or decreasing market volume.
Color Signals
Green curve → Volume increasing (bullish pressure building)
Red curve → Volume decreasing (bearish pressure building)
Unlike traditional volume bars, this indicator smooths volume data to show clearer momentum shifts.
Important: The indicator does not provide direct entry arrows. Instead, it confirms whether a move has sufficient volume strength.
How to Trade Using the Buy-Sell Volume Indicator
Breakout Confirmation Strategy
During consolidation phases, price often coils before a breakout. Volume confirmation is essential to avoid false breakouts.
Bullish Breakout Setup:
Price consolidates within a range.
Price breaks above resistance.
Volume curve turns green and rises above its recent range.
Enter long with stop-loss below recent support.
Bearish Breakout Setup:
Price consolidates within a range.
Price breaks below support.
Volume curve turns red and declines.
Enter short with stop-loss above recent resistance.
When volume rises alongside a breakout, it confirms strong market participation and reduces the risk of false entries.
Trend-Following Confirmation Strategy
The indicator is also effective in trend continuation setups.
Example:
Price forms a higher low in an uptrend.
The volume curve turns green and begins rising.
This confirms strong buying pressure → Potential long entry.
For downtrends:
Price forms a lower high.
Volume curve turns red and declines.
This confirms increasing selling pressure → Potential short entry.
Pros and Cons
✅ Pros
Clear visual color system (green/red)
Excellent breakout validation tool
Beginner-friendly and easy to read
Works across all timeframes
Complements price action strategies
❌ Cons
No direct buy/sell alerts
No automatic notifications
Depends on broker tick volume accuracy
Best Timeframes
The indicator works on all timeframes but performs especially well on:
M15
M30
H1
These timeframes provide balanced breakout opportunities with reliable volume confirmation.
Why Volume Matters
Volume provides insight into market participation and demand strength. A breakout without volume is often weak and prone to failure. A breakout supported by strong volume typically has higher follow-through potential.
Combining the Buy-Sell Volume Indicator with:
Support & Resistance
Candlestick patterns
Trendlines
can significantly improve trading accuracy.
Conclusion
The Buy-Sell Volume Indicator for MT4 is a simple yet powerful tool for analyzing volume strength behind price action. It does not generate direct signals but acts as a confirmation filter for breakout and trend trades.
It is especially suitable for beginners due to its clear color-based design, while advanced traders can integrate it into structured price action systems.
Used properly, this indicator helps reduce false breakouts and improve confidence in trade execution.
Frequently Asked Questions (FAQ)
⚡ Does the Buy-Sell Volume Indicator give direct buy or sell signals?
No. It confirms volume strength but does not generate entry arrows or alerts.
📊 Can I use it on any timeframe?
Yes. It works on all timeframes, especially M15, M30, and H1.
🛠️ How is it different from traditional volume bars?
It smooths and filters raw volume data to better highlight buy/sell pressure trends.
🔰 Is it beginner-friendly?
Yes. The green/red color system makes it easy to interpret.
💰 Can it be used for stocks and crypto?
Yes, as long as your MT4 broker provides volume (tick volume) data.
FAQ
Published:
Feb 20, 2026 06:25 AM
Category: