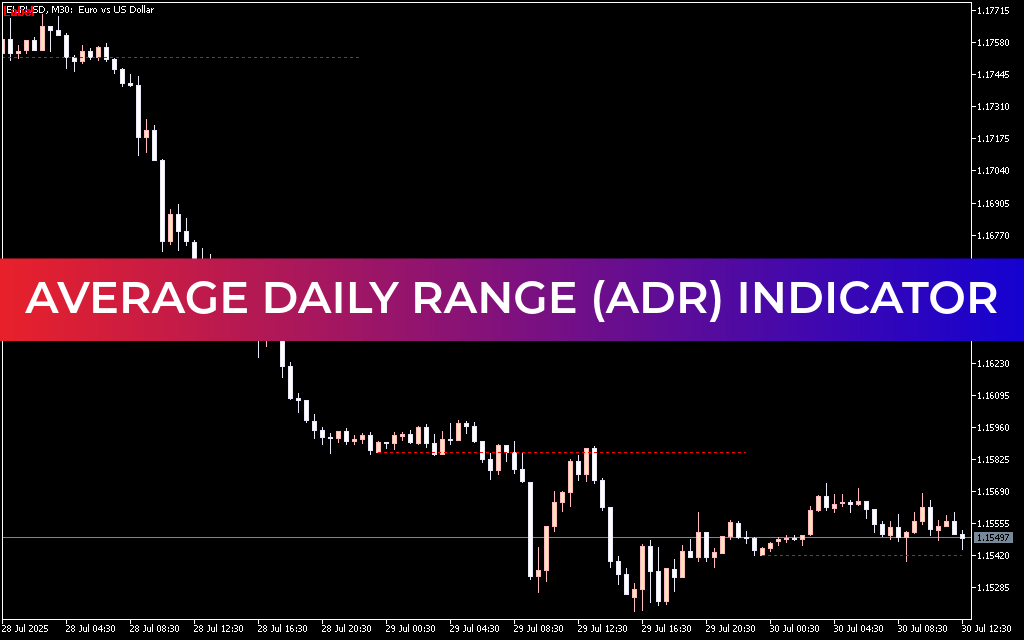
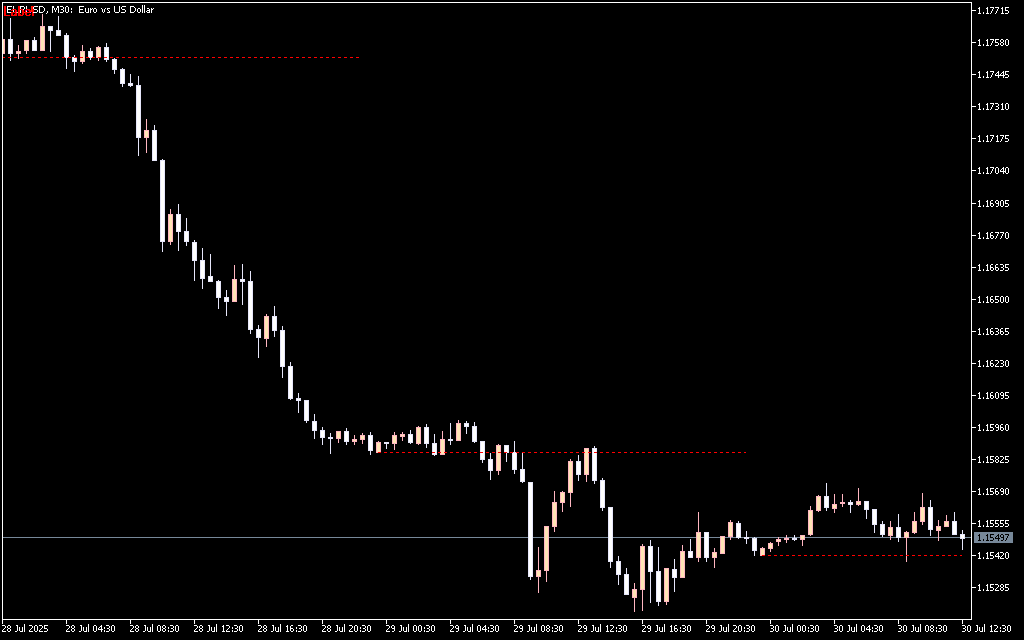
The Average Daily Range (ADR) Indicator for MT5 is a useful tool that helps Forex traders measure market volatility and the expected trading range of a currency pair. Understanding volatility is crucial because the most profitable trading opportunities usually occur when the market is actively moving.
When volatility is high, price movements become stronger and more frequent, creating potential trading opportunities. On the other hand, low volatility indicates a quiet market, where price movements are limited. The ADR indicator simplifies volatility analysis by automatically calculating the average daily range of a currency pair, allowing traders to make faster and more informed decisions.
Instead of manually calculating daily price ranges, the indicator displays the average trading range directly on the chart, saving valuable time for traders who rely on quick market analysis.
What Is the Average Daily Range (ADR)?
The Average Daily Range (ADR) represents the average number of pips a currency pair moves in a single day over a selected period, typically 14 days.
By analyzing this data, traders can estimate how far the price may move during the current trading day. The ADR indicator usually displays the value in the upper-left corner of the MT5 chart, making it easy to monitor market volatility at a glance.
When the current day’s range exceeds the average value, it indicates that market volatility is higher than normal.
Key Features of the ADR Indicator
- Calculates the average daily trading range automatically
- Displays 14-day ADR value directly on the chart
- Helps identify market volatility levels
- Assists in locating daily support and resistance zones
- Useful for day traders and scalpers
- Compatible with the MetaTrader 5 (MT5) platform
How the ADR Indicator Is Calculated
The ADR value is calculated by measuring the difference between the daily high and low prices over the last 14 trading days.
The formula is:
ADR = Sum of the last 14 daily ranges ÷ 14
Example:
If the daily ranges for the past 14 days are:
55, 76, 34, 42, 66, 89, 65, 45, 22, 101, 78, 33, 67, and 90
Then the calculation would be:
(55 + 76 + 34 + 42 + 66 + 89 + 65 + 45 + 22 + 101 + 78 + 33 + 67 + 90) ÷ 14 = 61.6 pips
So, the average daily range is approximately 62 pips.
This means that under normal conditions, the currency pair moves around 62 pips per day.
How to Trade Using the ADR Indicator
The ADR indicator can be used in several trading strategies, including breakout trading and reversal trading.
1. Breakout Trading
A breakout opportunity occurs when the current day’s range exceeds the average range calculated over the last 14 days.
Trading idea:
- Wait for the price to break the daily high or daily low
- Enter a buy trade above the breakout or a sell trade below the breakout
- Place stop loss based on recent Price Action
This strategy works well when market volatility increases.
2. Reversal Trading
Reversal setups occur when the price reaches the upper or lower limit of the expected daily range and begins to bounce.
Trading idea:
- If price reaches the top of the daily range, look for a sell opportunity
- If price reaches the bottom of the range, look for a buy opportunity
Traders usually confirm these setups with price action patterns or support and resistance levels.
Using ADR for Take Profit Levels
Many traders use the ADR value to determine realistic take profit targets. For example:
- If a currency pair has already moved 80–90% of its ADR, the probability of further movement may decrease.
- This helps traders avoid entering trades too late in the daily move.
Why Day Traders Use the ADR Indicator
The ADR indicator is particularly popular among day traders and scalpers because it helps them quickly identify:
- Potential breakout zones
- Possible price reversal levels
- The remaining movement potential for the day
With this information, traders can plan their trades more effectively and manage risk more efficiently.
Conclusion
The Average Daily Range Indicator for MT5 is a valuable tool for analyzing Forex market volatility and daily price movement potential. By displaying the 14-day average range directly on the chart, the indicator helps traders identify breakout opportunities, plan profit targets, and avoid low-volatility trading periods.
Whether you are a day trader, scalper, or swing trader, the ADR indicator can help you better understand market conditions and improve your overall trading strategy.
FAQ
Published:
Mar 08, 2026 13:00 PM
Category: