The Absolute Strength Indicator for MT5 is a versatile trend-following tool that helps traders evaluate both the direction and strength of market trends. By combining signal line crossovers with momentum analysis, this indicator delivers clear BUY and SELL signals while also showing how strong a trend is.
Designed for simplicity and accuracy, it is suitable for both beginner and advanced forex traders who want to make more informed trading decisions.
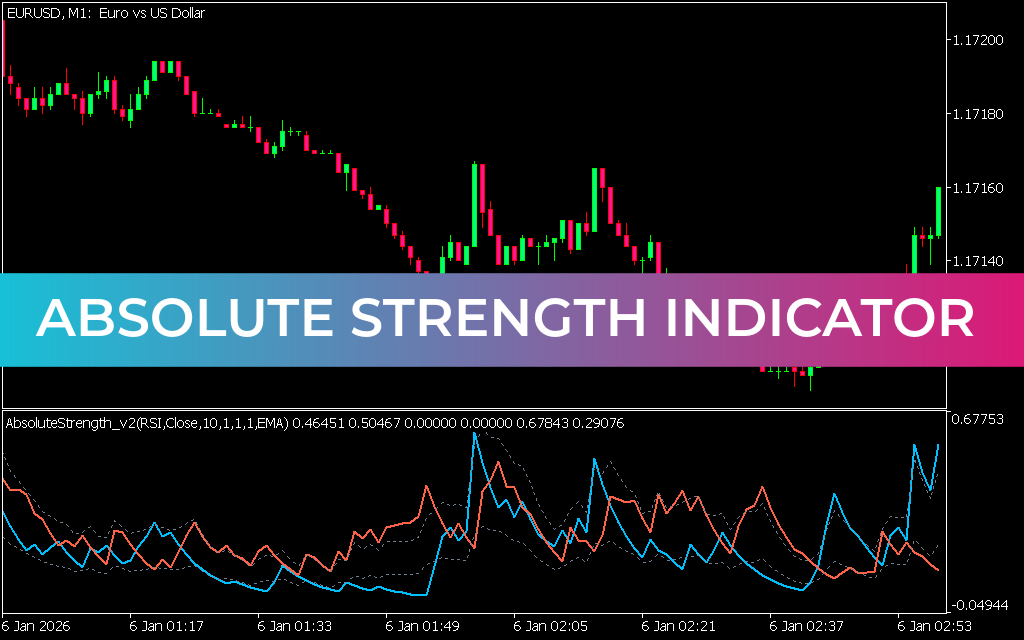
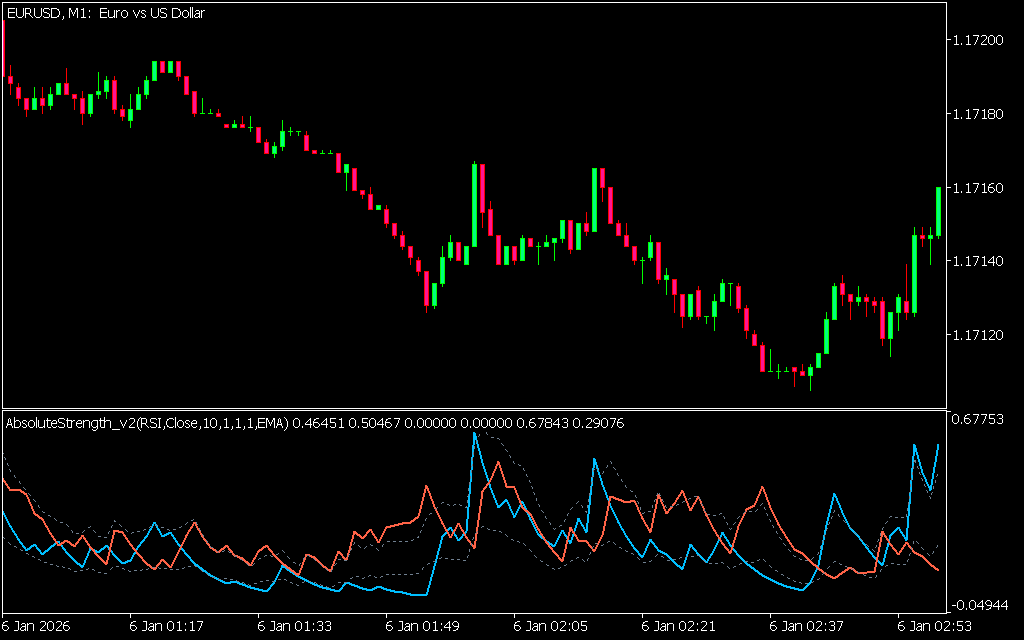
How the Absolute Strength Indicator Works
The indicator operates in a separate window and uses two key signal lines:
- Blue Line (Bullish): Represents buying strength
- Red Line (Bearish): Represents selling strength
Trading signals are generated based on the crossover of these two lines, while histogram bars indicate the intensity of the trend.
Key Features and Benefits
The Absolute Strength Indicator offers a complete trading solution with multiple advantages:
- Clear BUY and SELL signals through line crossovers
- Measures Trend Strength using histogram bars
- Helps identify both entry and exit points
- Works across all timeframes (intraday to monthly)
- Suitable for beginners and professional traders
It also integrates well with other technical tools like support/resistance levels, trendlines, and channels.
Trading Signals Explained
The indicator provides straightforward trading opportunities based on line crossovers:
Buy Signal
- The blue bullish line crosses above the red bearish line
- Indicates the start of a potential uptrend
- Enter a BUY trade
- Place stop loss below the previous swing low
- Hold the position while the bullish line remains dominant
Sell Signal
- The red bearish line crosses above the blue bullish line
- Signals a potential downtrend
- Enter a SELL trade
- Place stop loss above the previous swing high
- Hold the trade until an opposite crossover appears
Using Trend Strength for Better Decisions
The histogram bars play a crucial role in evaluating market strength:
- Taller bars: Indicate strong momentum
- Smaller bars: Suggest weakening trend
- Declining bars: Signal potential Trend Reversal or exit point
This allows traders to stay in strong trends longer and exit when momentum fades.
Practical Application
On a USD/JPY H1 chart:
- A bullish crossover (blue over red) signals upward momentum
- A bearish crossover (red over blue) confirms downward pressure
- Histogram height reflects the strength of buyers or sellers
This combination provides both direction and confidence in trade decisions.
Best Practices for Optimal Results
To maximize performance:
- Combine with Price Action for confirmation
- Use support and resistance levels for better entries
- Follow the dominant trend direction
- Apply proper risk management strategies
Advanced traders can further enhance accuracy by aligning signals with trendlines and Market Structure.
Final Thoughts
The Absolute Strength Indicator for MT5 is a powerful all-in-one tool for identifying trend direction, measuring momentum, and executing trades with confidence. Its combination of simplicity and depth makes it an excellent addition to any trading strategy.
Whether you're looking to catch strong trends or manage exits more effectively, this indicator provides the clarity needed to improve trading performance.
Published:
Apr 13, 2026 11:35 AM
Category: